Choose the right model for the workflow, not the leaderboard.
A decision workbench for comparing quality, latency, reliability, and operating cost against the job the model must perform before procurement commits budget or production risk.
- For
- AI product owners, engineering leadership, procurement, and governance
- Decision
- Which model is fit for this workload and operating constraint?
- Output
- Scenario-weighted shortlist with visible tradeoffs and evidence
- Build status
- Capability lab using representative benchmark inputs
A model comparison should end in a decision.
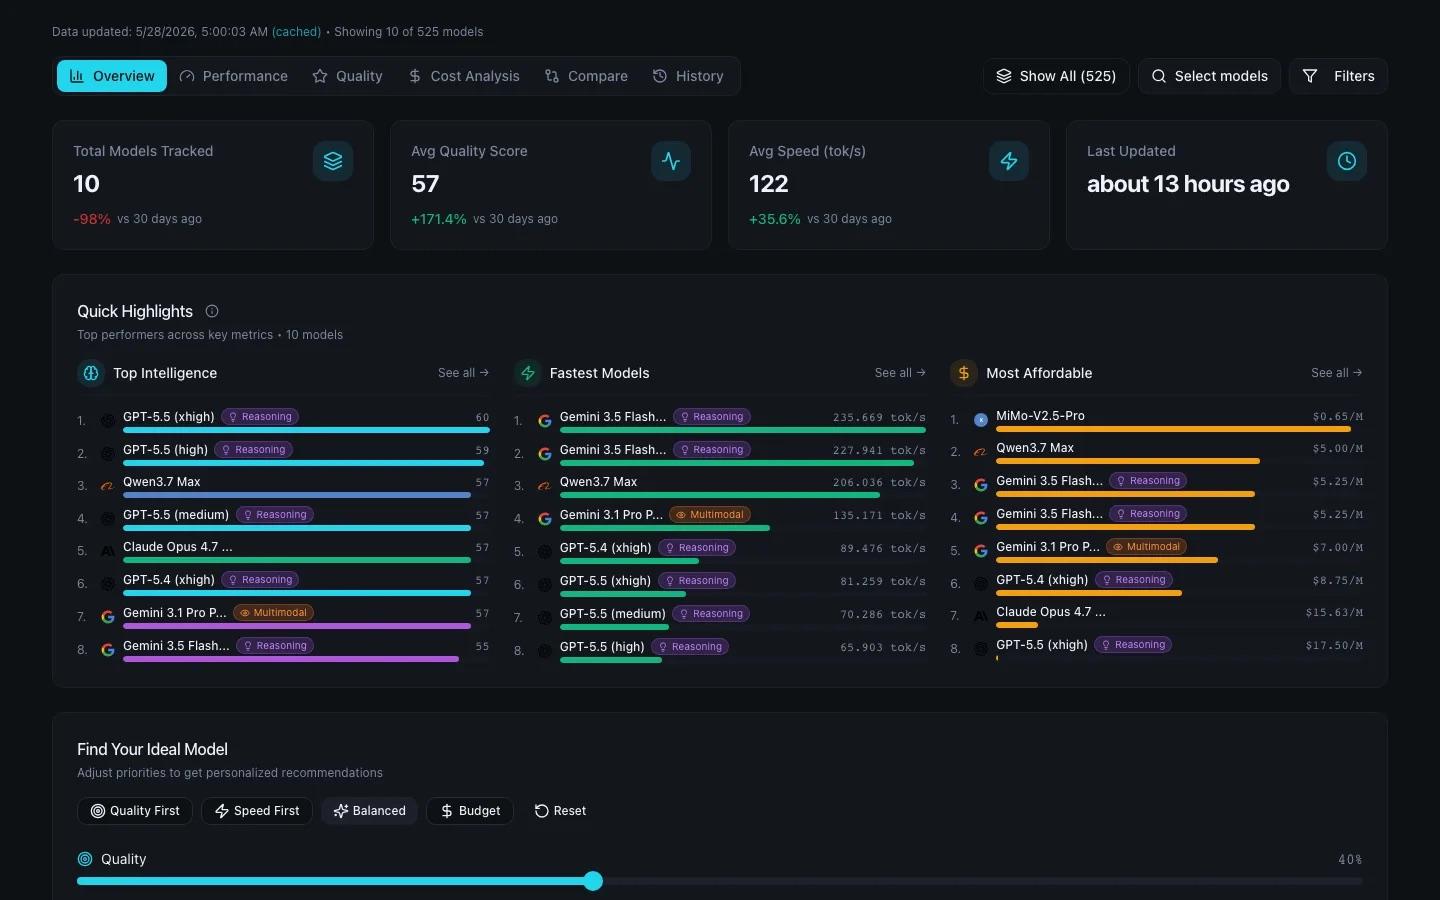
Inspect the decision surface for weighing task quality, speed, cost, and use-case fit. The capability lab uses representative benchmark inputs that require independent validation.
Capability lab — model and benchmark data must be independently validated
A benchmark matters only when it changes a decision.
Public leaderboards answer a general question. Procurement needs an operational one: which model is good enough for this task, at the required speed, reliability, control level, and cost?
Define the workload before scoring the models.
- 01
Define the task
Set the success rubric, data sensitivity, response-time requirement, expected volume, and failure tolerance.
- 02
Run task-specific evaluation
Compare quality against a representative evaluation set and a documented human-review rubric.
- 03
Expose production tradeoffs
Review tail latency, cost per successful task, reliability, deployment options, and data controls.
- 04
Record the decision
Keep the chosen model, alternatives, assumptions, evidence date, and review owner together.
What this build demonstrates—and what a client-specific pilot would validate.
Review the capability, then define the data, controls, integrations, owners, and acceptance criteria for a bounded pilot.
- -Model selection can be framed as a repeatable operational decision instead of a general ranking exercise.
- -Quality, latency, reliability, cost, and governance can stay visible in one review surface.
- -A useful pilot begins with one workload and a reproducible evaluation method.
A production deployment needs dated sources, reproducible tests, versioned model IDs, evaluation ownership, and a visible methodology. Cached or sample data must never be presented as a current market ranking.
- -A lightweight model-evaluation dashboard connected to existing benchmark data.
- -Decision views for cost, response quality, speed, reliability, and use-case fit.
- -A roadmap for turning model comparisons into real AI workflow decisions.
Questions buyers may ask
Is this a replacement for technical model evaluation?
No. It is a decision layer that makes validated evaluation results and operating tradeoffs easier to compare.
Can public leaderboard data be enough?
Usually not. Production selection should use representative tasks, current model versions, realistic load, and the organization's own quality and governance requirements.
What should be versioned?
The model ID, evaluation set, scoring rubric, test date, deployment configuration, assumptions, and decision owner.
Build a model decision you can explain and repeat.
Start with one high-value workload, agree on the success rubric, and make the commercial and technical tradeoffs reviewable before procurement.